
PrOGrid Project Optimized Gridding™
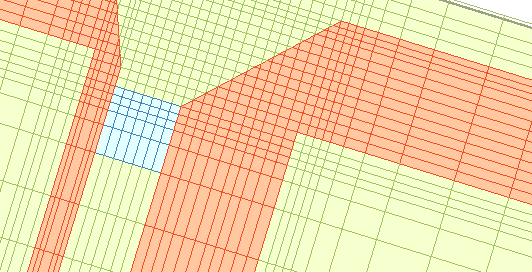
New capability in the gridding algorithm allows users to create grids that conform to best practices and guidelines. While the underlying gridding algorithm remains unchanged, PrOGrid's new controls in the main grid editor and part gridding properties enable users to efficiently optimize the trade-off between accuracy and runtime.
Users can control the following aspects of gridding:
- Finer resolution around conductor edges where fields are strongest.
- Minimum number of cells across features, e.g., microstrips and substrates.
- Smaller cells inside dielectrics where the wavelength is shorter.
- Free space padding that is determined based on a fraction of a wavelength.
Poseable Hand
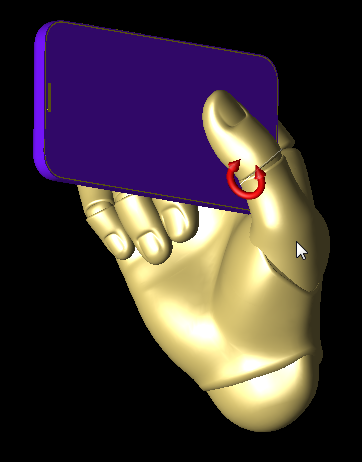
XF can mimic the numerous grips used to hold mobile devices when users import Poseable Hands from CADHuman and reposition them using controls at each joint in the fingers and thumbs. Users can also align the imported models with other parts in the project, making it easy to grip a device with the imported hand.
Customers who wish to use this capability can purchase the Poseable Hand models directly from CADHuman.
Biological Thermal Solver
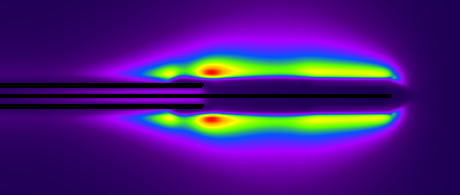
XF's enhanced thermal sensor allows users to include metals and other non-biological objects in the temperature rise computation. The calculations are based on Pennes' bioheat equation and consider the effects of conductive heat transfer between thermally connected materials, blood perfusion, metabolic processes, and general radio frequency (RF) heating.
The new sensor is well-suited for analyses related to the following topics:
- Therapeutic heating devices.
- MRI heating in patients, including effects of implants, probes, and electrodes.
- Microwave thermal ablation.
- Implantable devices.
MATLAB Export
 All data available through XF's results browser can be exported to MATLAB and CSV formats. This enables full post-processing of data with MATLAB's extensive mathematical and visualization capabilities.
The export includes the following highlights:
- E, H, B, and J fields for point, planar, and volumetric sensors.
- Rotating B+/- and specific absorption rate (SAR) results.
- Grid vertex locations and mesh material properties needed for custom SAR post-processing.
Cropped 3-D Mesh
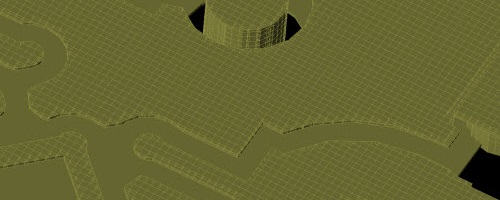 Rendering the full geometry as a 3-D mesh can be a time consuming process. New controls allow users to specify and view a cropped section of the mesh. The section can either be specified as an arbitrary box or based on the bounding box of selected parts.
STL Import
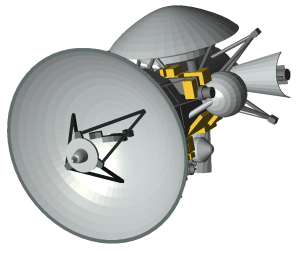 XF supports STL file formats for import, and can identify multiple objects in a single file and separate them into individual parts. This allows the various parts to be oriented separately and assigned different material definitions. STL files are imported through the File > Import > CAD file(s) menu.
Dispersive Material Calculator
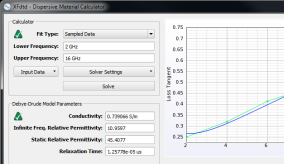
XF provides a dispersive material calculator that fits a single-pole, frequency-dependent, Debye-Drude material to a set of material data points over a frequency range.
Users can input data points in the following ways:
- Sampled data: based on measurements of a material taken at multiple frequencies.
- Constant loss tangent: a constant relative permittivity and loss tangent over a frequency range.
Picking Geometry Edges and Vertices
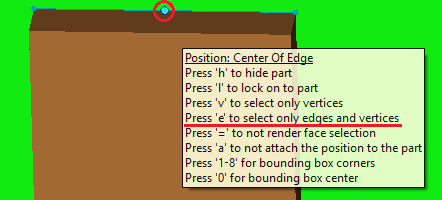
This release offers additional choices for connecting the picker tools to specific edges or vertices rather than selecting geometry faces. These restrictions allow users to easily choose an exact edge or vertex when using the picker tools for placing components, specifying orientation, or attaching waveguide interfaces.
Users can explicitly direct the picker tools using the following keys:
- v: select only from vertices and avoid connection to faces or edges.
- e: select only from vertices and/or edges and avoid connection to geometry faces.
Graph Select Tool
- Left-click and drag: zooms to the selected area.
- Right-click and drag: pans through the graph.
- Scroll middle mouse wheel: zooms all bounds in or out.
 button in the upper-left corner of the application will undo the last action to the graph while the window is active.
Graph Font Sizes
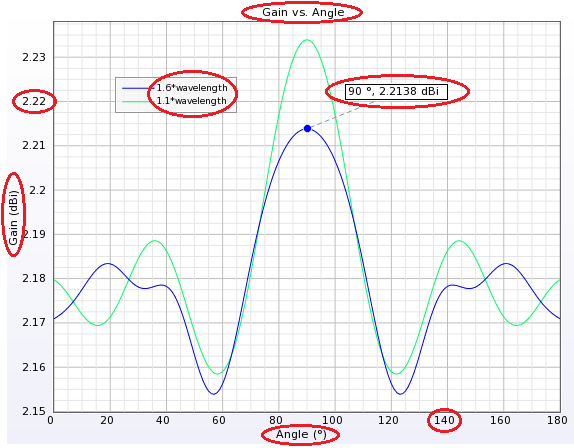 Graph title, legend, number, and marker font sizes are editable for improved readability within the UI, as well as graphs that are exported for reports. These settings are available in the graph properties tab, and can either apply to a single graph or change the default behavior for all graphs.
Constraint Enhancements
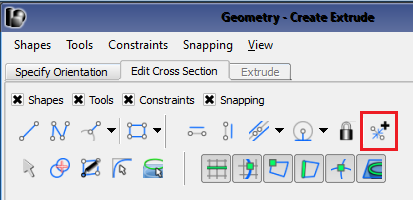 The 2-D sketcher's constraint tools include a button that controls automatically applied constraints. While sketching, XF detects lines that are vertical, horizontal, perpendicular, or parallel, and applies constraints that maintain their orientations. This allows users to manually control when constraints are applied for complex geometries.
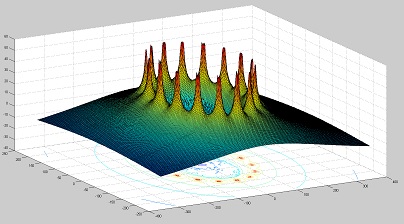
Option for Increasing Accuracy of Steady-State Results
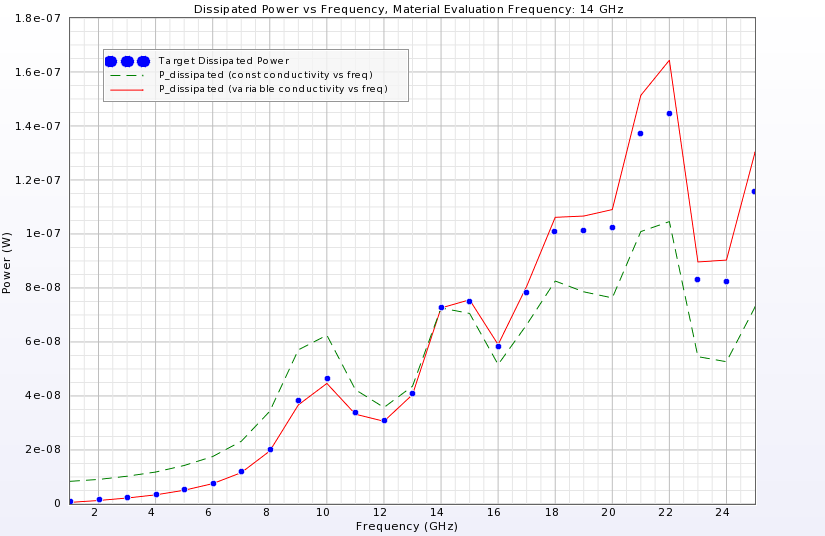
The option to use frequency-dependent material properties on nondispersive materials has been added to the frequencies of interest tab when creating a new simulation. Also for a simulation, nondispersive materials are evaluated at a single frequency for time stepping, even if they are entered as a loss tangent or complex permittivity. When processing results for multiple steady-state frequencies, this option adjusts each material's permittivity, permeability, and conductivity to match the appropriate value at each requested frequency. This affects results including dissipated power, SAR, and magnetic flux.
In the image, the blue dots were generated from multiple simulations that used a sinusoid and associated conductivity at each frequency. The green and red plots represent two simulations that each had the material evaluation frequency set to 14 GHz. The red plot had the new option enabled and shows a higher level of accuracy. Using this option in conjunction with the near-field method of the dissipated power algorithm improves dissipated power and efficiency results over a range of steady-state frequencies.
By default, this option is disabled due to cases in which increased dissipated power can lead to a negative radiated power result. For example, Pradiated = Pinput−Pdissipated.
Increased FFT Resolution
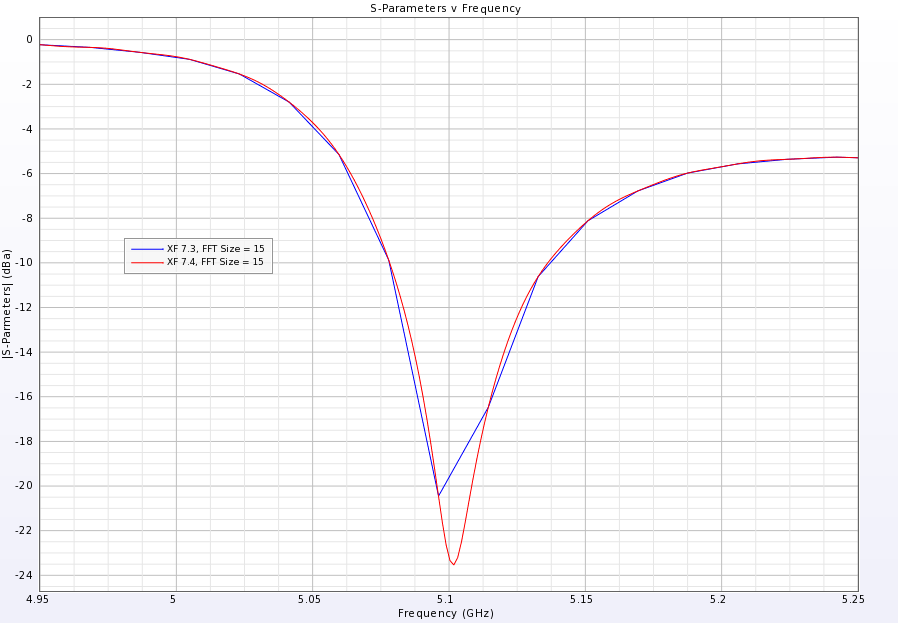
The fast-fourier transform (FFT) algorithm generates more data points in the project's frequency range of interest with increased efficiency. This update increases the resolution, or smoothness, of frequency domain plots, such as S-parameters and impedance.
Users who increased the minimum plot FFT size in the application preferences for smoother frequency domain graphs should reduce this value; an FFT size of 21 is no longer necessary.
Additional Capabilities
This version introduces over 80 usability, performance, scripting, and other updates.Here is a select list of modifications:
- Added XStream ® settings to the simulations window with accessibility through the queue options, then the advanced tool button.
- Added support for importing Pro/Engineer Creo 2.0 files.
- Improved import dialog with ability to save and restore ODB++ settings in order to apply common settings across multiple, unrelated models. The total board thickness is displayed under the layers tab of the import dialog.
- Improved measure tool functionality to display multiple measurements simultaneously for behavior similar to the geometry picker tools. Added tooltip information about the hotkeys available for use while measuring.
- Added ability to control result scaling by editing the entries in the 3x3 HAC grid readout. Information in the threshold tooltip displays the additional power scaling required to reach M1, M2, M3, and M4 ratings.
- Improved face selection performance for a surface sensor on a complicated model.
- Added font size and color control rendering options to the application preferences general tab for use with the measure tool, constraints, and bounding box markup.
- Added the waveguide name and boundary type to the mesh location information viewer when an electric mesh edge on the boundary of a waveguide interface is highlighted.
- Improved output from multiple ranks when using the message passing interface (MPI) version of XFsolver to no longer interlace, and augmented it with additional information.
- Added frequency resolution readout to the create line graph dialog.
- Added ability to slow down graphical rotation and translation operations using the mouse for increased control over positioning. Each of the Shift+, Alt+, and Ctrl+ keys pressed when clicking to perform a translation or rotation slows the motion by a factor of two.
- Updated rendering of selected items for translucent appearance of various operations, resulting in a more easily understood spatial relation to the other geometry. Examples include selecting faces for a surface sensor and visible circuit component endpoints located in or behind another object.
- Improved functionality after picking the first endpoint of a circuit component to immediately activate selection of the second endpoint.
- Added ability to set a maximum aspect ratio on grid cells.
- Added ability to select or deselect all nets in the ODB++ import dialog.
- Added ability to import and export application preferences, enabling users to copy the XF environment of one machine to another.
- Added option to maintain assembly information when exporting geometry to STEP and IGES formats.
- Improved the box sensor editor with additional graphic control that simplifies changing its size.
- Improved accessibility of XF's assistant with both a view menu option and button located in the right sidebar.
- Improved quality of higher-order modes returned from the waveguide mode solution, particularly in cases with unevenly-spaced grids.
- Improved overall performance when moving parts in projects containing many parts.
- Fixed issue causing transient and steady-state results to degrade over time for runs containing hundreds of thousands of timesteps and using a sinusoid excitation.
- Resolved issues causing malformed edges in the 2-D sketcher that resulted in various errors, such as incorrect or invalid behavior in the 2-D sketcher or subsequent geometry. Examples include improper profile has self intersections invalidity and geometry with incorrect face normals.
- Changed waveguide port S-parameters and group delay results to be reported with respect to a reference location in the plane of the waveguide interface. These results were previously reported with respect to a reference plane one grid cell inside the waveguide.
- [Scripting API] Added DissipatedPowerDensity to ResultQuery.ResultType
- [Scripting API] Added methods RelativePosition.isRelative() and RelativeDirection.isRelative()
- [Scripting API] Added DimensionReducingDataSet to support graphing of derived results created through scripting.
- [Scripting API] Added methods to Project to obtain the current simulation memory requirements.
- [Scripting API] Added File.flush() to flush everything in the file's buffer to disk.
- [Scripting API] Added ParameterList.setFormulas() to efficiently set multiple parameter formulas in one call.