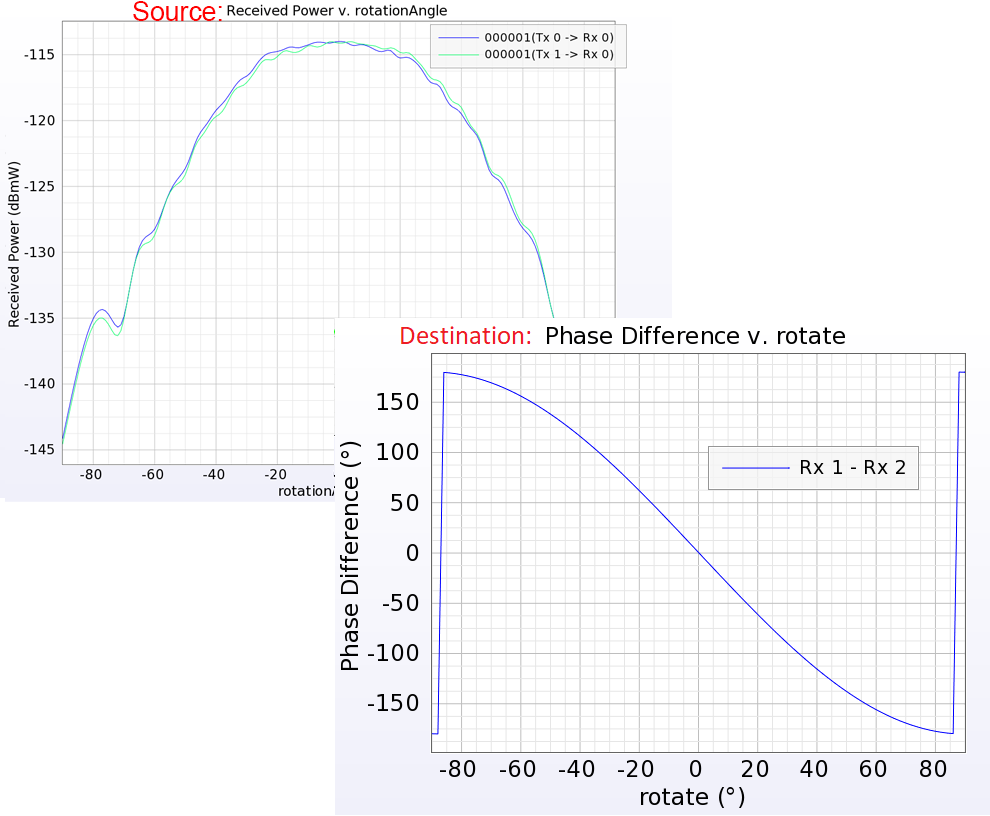
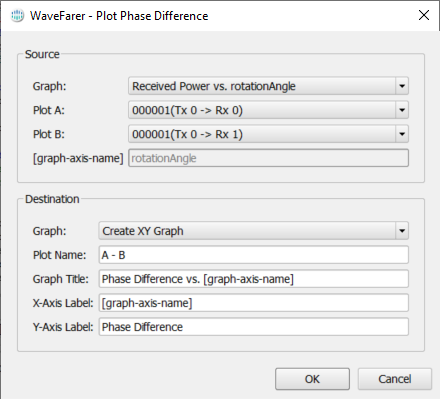
The Plot Phase Difference script allows users to select two plots from an existing graph and compute the angular difference between them. It is a fully featured script with an interactive user interface.
Use Case

Inconsistencies may exist between the measurement setup and user-defined antenna in WaveFarer. This script can be used as a part of one import verification method, which compares the phase difference between the two receivers of the physical prototype to that of the WaveFarer simulation. Users can reference the User-Defined Antennas tutorial for an example.
The script can be applied to any graph that meets the following conditions:
- It exists in the project tree.
- It is an XY graph.
- It contains two or more plots.
- It has an a-axis with length or angle units.
- It has a y-axis with an angle unit.
Workflow
Execute the macro using the following steps:
- Download the Plot Phase Difference script.
- Right-click on the Scripts branch of the Project Tree, then select Import Scripts.
- Right-click on the imported script in the Project Tree, then select Execute.

Once the script is executed, a window opens allowing users to specify which result to plot.
- In the upper portion of the editor, specify the existing graph and two plots by choosing from the drop-down menus.
- In the lower portion of the editor, specify the destination for the phase difference by choosing from the drop-down menus.
- Click OK to close the editor.
The script will access the data associated with the two plots, subtract them, and generate a new plot as specified in the destination fields. A special tag, [graph-axis-title], will be evaluated during script execution and serves as a convenient way to reuse the x-axis title from the source graph.
- Double-click on the graph in the Project Tree to view the new plot.


