
The Plot Received Power vs Parameter script allows users to select a simulation containing a parameter sweep and generate a graph of received power versus the swept parameter's values. It is a fully featured script with an interactive user interface.
Use Cases
The following examples are just a few of the instances in which a plot of either received power versus distance or received power versus angle is of interest:
- Corner reflector tutorial: plots the magnitude of received power where the corner reflector's distance from a transceiver is swept from 5 m to 160 m, exhibiting the $1/r^4$ reduction in power versus distance.
- User-defined antenna tutorial: plots the phase of received power where a simple scattering object is swept around the transceiver from -90 degrees to +90 degrees, allowing users to verify the phase difference between receiver antennas.
- Target characterization: plots the magnitude of received power versus angle, where a transceiver is swept the full 360 degrees around a target at a fixed distance. When converged to a histogram, this provides a statistical scattering characterization for a complex target.
The script can be applied to any simulation that meets the following conditions:
- Only one parameter is swept.
- The swept parameter has a unit of length (e.g., meters, yards), angle (e.g., degrees, radians), or time (e.g., seconds, milliseconds).
Workflow
Execute the macro using the following steps:
- Download the Plot Received Power vs Parameter script.
- Right-click on the Scripts branch of the Project Tree, then select Import Scripts.
- Right-click on the imported script in the Project Tree, then select Execute.
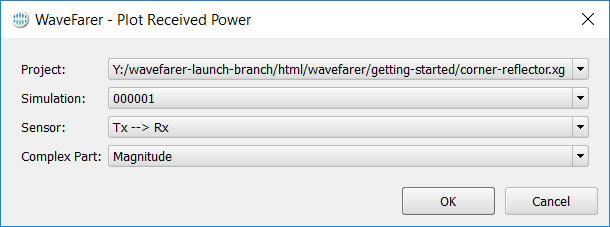
Once the script is executed, a window opens allowing users to specify which result to plot.
- Specify the desired result by choosing from the drop-down menus.
- Click OK.
The projects in the editor's drop-down menu match those listed in the Results browser. If the desired project is not availabe through the script, it can be added in the Results browser.
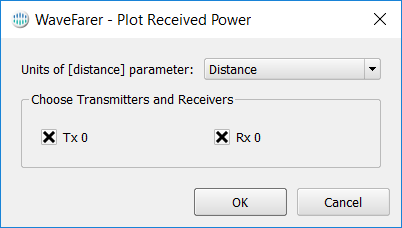
The script will access the swept parameter's name and insert it between brackets in the next window. The editor allows users to specify the parameter's units from the drop-down menu, as well as select which transmitters and receivers to plot.
- Specify if the simulation's parameter sweep units using the drop-down menu.
- Check at least one transmitter and at least one receiver.
- Click OK.
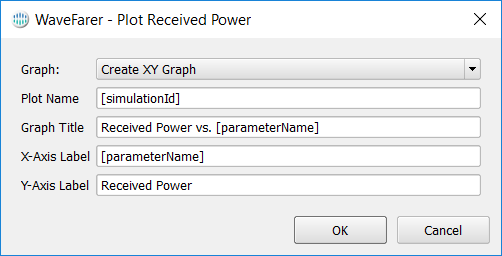
The last window will open allowing users to specify where to graph the data.
- Select whether to create a graph or use an existing one using the Graph drop-down menu.
- If desired, change the Plot Name, Graph Title, and axis labels.
- Click OK to close the editor.
Two special tags, [simulationId] and [parameterName], will be evaluated during script execution. They can be used in any of WaveFarer's fields.
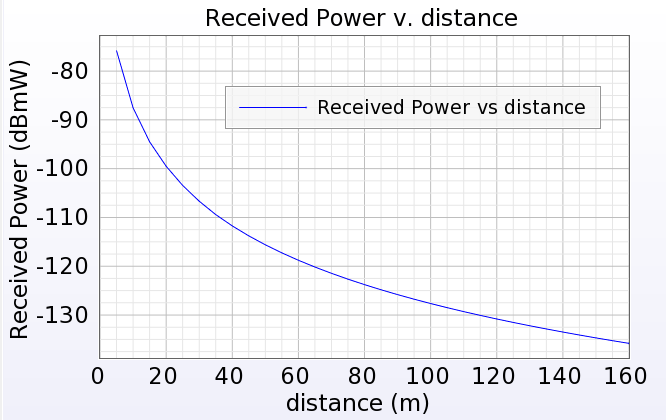
The script loads received power for each value in the parameter sweep and adds it to a Graph to the Project Tree.
- Double-click on the graph in the Project Tree to view the new plot.