Antenna arrays are preferable in certain applications because of their beam steering ability, but analyzing a design for tens or hundreds of beam patterns is unwieldy. One way to condense this data into a single metric is to measure the cumulative distribution function (CDF) of effective isotropic radiated power (EIRP) for numerous beam patterns.
Definitions
EIRP is a function of direction and is defined as the gain of a transmitting antenna in a direction multiplied by the power delivered to the antenna from the transmitter [1].
EIRP is equivalent to the power that must be delivered to an isotropic antenna in order to produce the same signal level in the given direction. For example, if an antenna accepts 2 mW (≈3 dBm) from the transmitter and the antenna's gain is 5 dB in a given direction, then the EIRP in that direction is 8 dBm. This means that the signal in that direction is equal to that of an isotropic antenna fed with a power of 8 dBm.
Please log in to view this content.
Remcom customers and those interested in our products may access this content after logging in.
Interpretation
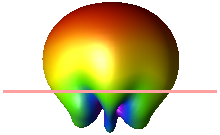
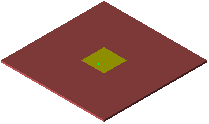
A simple patch antenna demonstrates the concept of EIRP and the meaning of the CDF of EIRP calculation. The patch is tuned to 28 GHz and mounted on a 15 mm by 15 mm dielectric substrate of 0.254 mm thickness that is backed by a ground plane. The single patch produces a pattern in the region above the ground plane with a peak gain slightly over 7 dBi pointed in the direction above the patch. Further adjustments to shape the pattern or point it in different directions are impossible due to the antenna consisting of a single patch. If the power available to the patch is adjusted to 23 dBmW, the expected peak EIRP is the sum of the antenna gain (7 dBi) and the available power (23 dBmW), or around 30 dBmW.
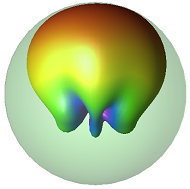
This EIRP level is illustrated by comparing the actual antenna pattern to an ideal spherical pattern of an isotropic radiator with a gain at the EIRP level of 30 dBmW. The actual patch antenna pattern in the direction of the peak gain reaches the 30 dBmW level, but the other directions, particularly those under the ground plane, reach significantly lower power levels compared to the green sphere of the isotropic radiator.
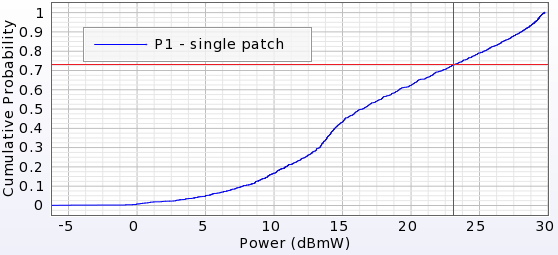
The CDF of EIRP calculation determines the peak EIRP level present at the maximum gain location of the antenna pattern, as well as the possible coverage of the antenna for a given available power. The CDF of EIRP plot of the single patch, P1, shows that the peak EIRP where the y-axis is 1 is approximately 30 dBmW, as expected. At the available power level of 23 dBmW, the plot crosses the fractional area of 0.72576. This places approximately 72.6% of the gain pattern below the available power level, indicating that there is negative gain. In other words, approximately 100 minus 72.6, or 27.4% of the pattern has positive gain.
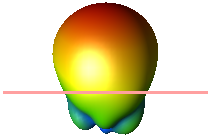
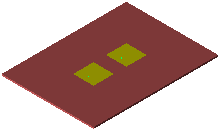
This analysis may be possible with a simple radiation pattern, but determining the antenna's coverage for more complex devices is less straight-forward. For example, a simple array that adds a second patch element a half-wavelength offset from the first element of the original antenna produces a gain pattern similar to the single patch, but with a peak gain of nearly 12 dBi when both elements are fed in phase.
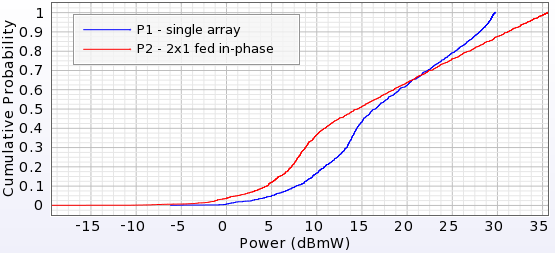
When comparing the plots of the single patch, P1, and the CDF of EIRP for the 2x1 array with in-phase feeding, P2, the max gain for the two antenna patterns is determined by looking at the cumulative probability of 1. P1 and P2 have a max gain of approximately 30 dBi and 35 dBi, respectively. P2 provides higher EIRP values covering 1 minus 0.675, or 32.5% of the angles as shown in the upper-right portion of the graph, but crosses P1 at 21.5 dBmW, providing lower EIRP for the remaining 67.5% of angles. This demonstrates that a 2x1 array is more directional over a limited set of angles than a single patch, as expected.
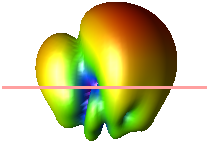
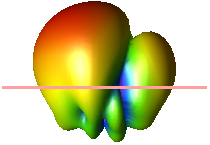
Users can steer the beam by adjusting the phase between the elements, such as adding a phase shift of plus or minus 90 degrees to one element. The additional beams provide a higher gain in more directions than the single in-phase pattern.
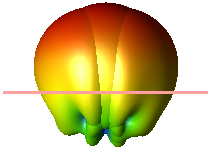
The 3-D max hold result shows the radiation pattern for the three beams: +90 degrees, in-phase, and -90 degrees.
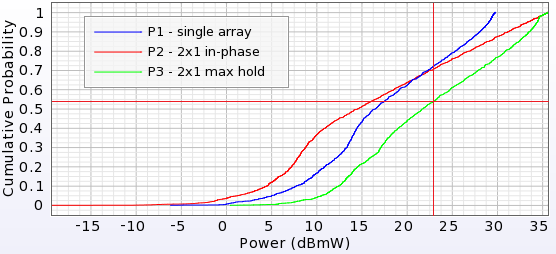
The plots of P1, P2, and the CDF of the max hold of the three beams, P3, show that P3 shares the max gain with P2 and that the 2x1 array with beam steering provides better coverage over all angles when compared to the single patch result of P1. An available power of 23 dBmW indicates that (1 - 0.542) 45.8% of the angles show a positive gain.
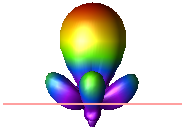
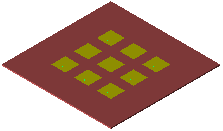
As more elements are added to the array, 2-D beam steering allows for more coverage. In simulations performed for a 3x3 array with 9 total elements, the beam becomes increasingly focused and generates a peak gain of 21.6 dBi when all ports are fed in-phase. The CDF of the 3x3 array with all ports fed in-phase appears in the P4 plot.
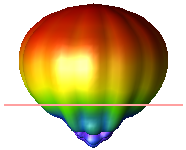
In order to analyze the 2-D beam steering capability, array optimization determined the sets of port phases that pointed the beam in 24 directions, including theta equals 0, 15, and 30 degrees and phi equals 0 to 360 degrees with 30 degree increments. The 3-D max hold result was generated from the 24 patterns and its corresponding CDF appears in the P5 plot.
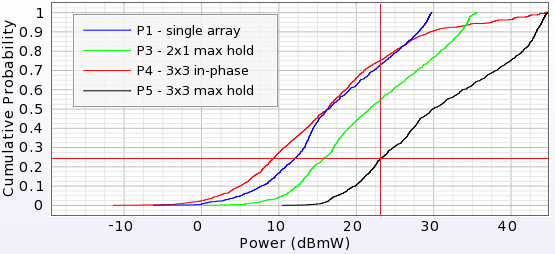
P4 shows a peak EIRP of approximately 43 dBmW and a near-horizontal response down to 30 dBmW. This result is characteristic of a highly directional pattern with a narrow beam.
The peak EIRP of P5 is equivalent to that of P4. This is expected because the 3x3 array has a peak gain when the ports are fed in-phase. The in-phase pattern contributes to the max hold result over the boresight angles. As the max hold moves away from boresight, the other 23 patterns contribute to the directions where their beams are pointing. As a result, P5 shows the contribution of 24 separate patterns that provide high gain over a much greater range of angles. With an available power of 23 dBmW, 1 minus 0.236, or 76.4% of the angles show positive gain.
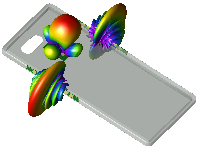
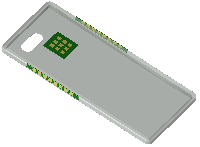
A single array antenna covers a limited range of angles and is not capable of full 3-D coverage. Multple arrays are required in order to increase coverage.
A mobile phone case provides a more practical example when used as a platform for holding three separate arrays of patch antennas. The gray phone case has two 1x8 element arrays on each side and one 3x3 array on the back. When all elements are fed in-phase, the 1x8 arrays produce a fan shaped pattern that is narrow in the vertical direction but broad in the horizontal direction. The 3x3 array produces a focused beam that can be steered in two directions over the back plane of the phone. Each of these three arrays produces a pattern that covers a different sector of the radiation sphere.
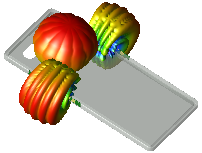
Using the 1x8 arrays, five beams were generated that point in 0, ±15, and ±30 degrees off boresight. The 3-D max hold radiation pattern for one array is determined using its five patterns and appears as the CDF in the P6 plot. The 3x3 array supports beamforming in two dimensions and 24 beams were analyzed as explained previously. The CDF of the 3-D max hold radiation pattern appears in the P7 plot. P5 and P7 differ only in that the latter array is impacted by being mounted on a device.
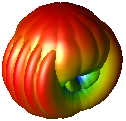
Each of the three mobile phone array patterns is capable of scanning over large regions, but combined they cover the entire sphere surrounding the phone more efficiently. A final max hold result combines the 34 beams—five from the left 1x8 array, five from the right 1x8 array, and 24 from the 3x3 array—to produce a 3-D radiation pattern showing full coverage around the phone. The CDF of this max hold appears in the P8 plot.
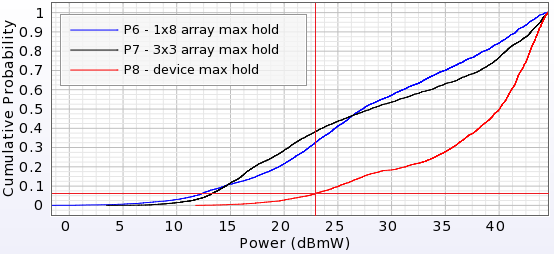
With the available power adjusted to 23 dBmW, the CDF of EIRP plots show slightly higher coverage for the 3x3 array than for the 1x8 arrays. Data for only one 1x8 array is plotted since the second array produces a nearly identical CDF result of the max hold of the five beams. However, because the two 1x8 arrays are on opposite sides of the phone case, a much larger set of angles is covered with higher gain when they are used together and combined with the 3x3 array. This provides positive gain for 1 minus 0.062, or 93.8% of the angles.
Angular Sampling
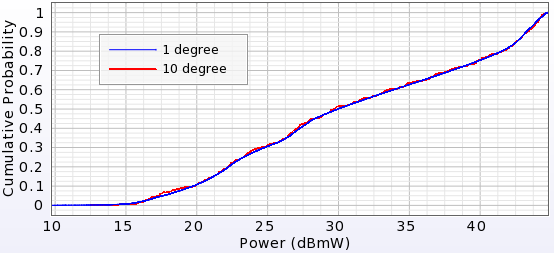
In order to compute max hold, it is necessary to generate a three-dimensional gain pattern for each active source. For example, a far zone sensor computes fields from theta equals 0 to 180 degrees with 2 degree increments and phi equals 0 to 360 degrees with 2 degree increments.
Performing the calculation necessary to generate the CDF of max hold plot is time-consuming with a large number of angular points that must be considered. Although an individual pattern can be complex with many nulls, the max hold computed from the individual patterns is often fairly simple. Generally, a highly sampled antenna pattern is unnecessary in order to obtain accurate results, but users should check their patterns' sensitivity.
In the 3x3 planar patch array's max hold result based on 24 patterns, P5, two additional simulations show the impact of the theta and phi increment values. The 1 and 10 degree increments generated a total of 37.32M and 0.37M far zone data points, respectively. The plot with 10 degree sampling is virtually indistinguishable from that with 1 degree sampling and is computed in much less time.