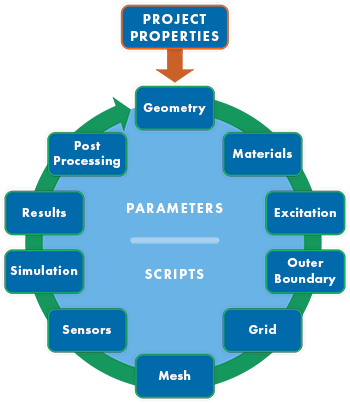
Analyzing averaged specific absorption rate (SAR) follows the standard simulation workflow with special considerations that apply to several steps. The following information pertains to both 1-gram and 10-gram averages in accordance with IEC/IEEE 62704-1 [1].
This analysis focuses on the aspects of the simulation workflow relevant to SAR calculations:
- Geometry: include both the antenna and phantom.
- Materials: set the physical parameters for each tissue.
- Mesh: enable dielectric volume averaging for phantom geometry.
- Sensors: create a SAR averaging sensor.
- Simulation: specify discrete frequencies and optionally enable S-parameters.
- Results: adjust the net input power.
- Post-processing: apply a schematic and calculate the average SAR values without rerunning an FDTD simulation.
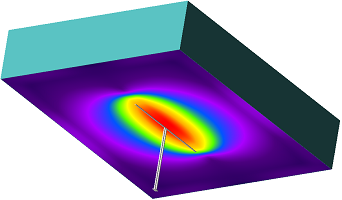
This discussion utilizes a dipole antenna and flat phantom in order to illustrate the various steps, however, the workflow also applies to magnetic resonance imaging (MRI) and other SAR applications [2].
Geometry
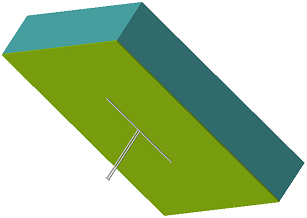
SAR simulations evaluate the radiation from an antenna into a tissue in order to model human exposure, so the project must include both the antenna and phantom geometry. The antenna geometry may contain an imported printed circuit board (PCB) and solid model of the full device to accomodate the desired level of detail. For certain applications, the phantom geometry may include a poseable hand, phantom head model, flat phantom, or a 1 mm resolution human voxel model.
This example includes a dipole antenna with a flat phantom. This cuboid is referred to as a flat phantom because its surface distinguishes it from the characteristic shapes of other phantom geometry, such as a head model. Phantoms typically have a shell material representing the skin, and a thicker, inner, liquid material representing the tissue being evaluated for exposure.
Materials
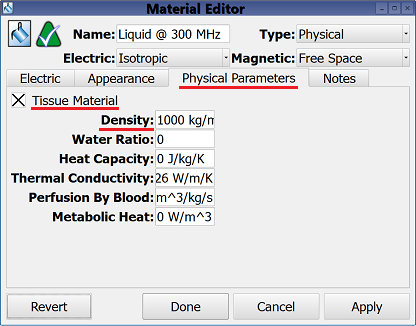
The standard workflow guidelines for defining materials are applicable to computing averaged SAR. Users should therefore enter conductivity and permittivity values that are representative of the material being evaluated for all geometry.
Additionally, users must set the physical parameters for each tissue material by checking the tissue material option and providing a density value. The remaining parameters—water ratio through metabolic heat—are not relevant to SAR computations.
Mesh
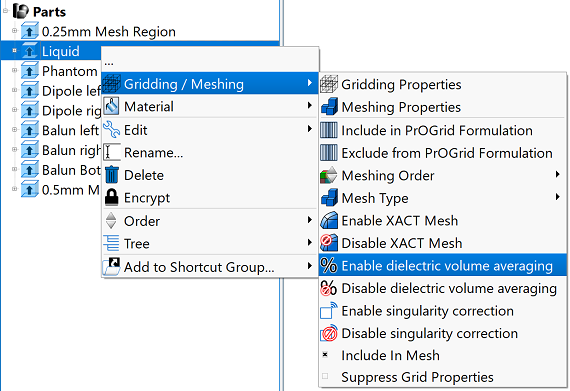
The IEC/IEEE standard requires that dielectric volume averaging (DVA) be enabled on the phantom geometry where exposure is computed.
Sensors
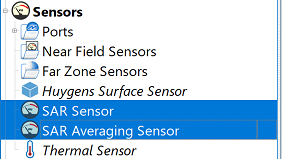
XF provides SAR and SAR averaging sensors through the project tree. A SAR sensor is the appropriate choice when only unaveraged SAR values are desired. Because SAR averaging is dependent upon raw SAR data, XF initializes the necessary SAR sensor once a SAR averaging sensor is added. It is unnecessary for users to create both.
Creating a SAR averaging sensor allows users to choose 1- and 10-gram computation options, as well as define the averaging region and specify tissue materials.
Simulation
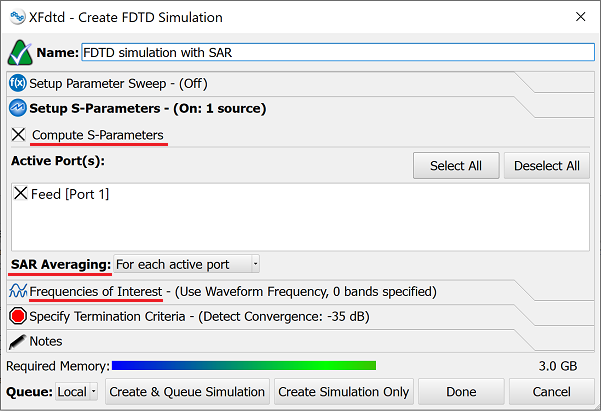
When creating an FDTD simulation, the setup S-parameters tab determines which feeds are active, as well as the available computing options. When the compute S-parameters setting is unchecked, all feeds are active simultaneously and SAR is computed during the simulation.
When checked, this setting excites each feed individually and provides additional options. Users can either compute SAR averaging for each feed individually as part of the FDTD simulation, or delay SAR averaging until post-processing. The latter supports matching network design and VOP compression workflows where a schematic modifies the input power at each port prior to computing averaged SAR.
Independently of the S-parameters tab, SAR is a steady-state value that relies on steady-state data. Before averaging is performed, users must specify the discrete frequencies of interest at which to collect the required data.
Results
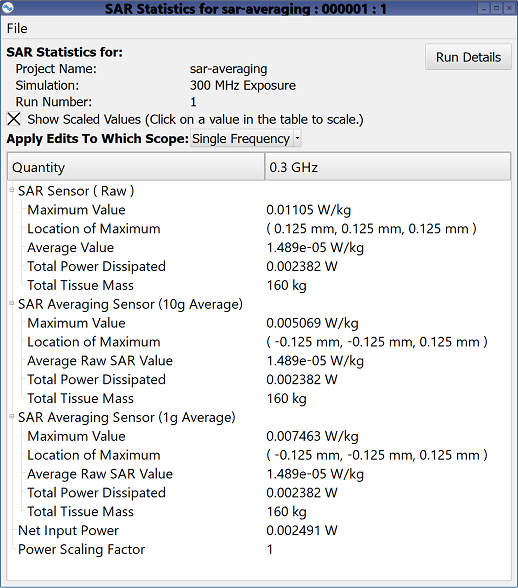
Once the simulation is complete, SAR statistics are presented in a summary table with accompanying field visualization in the geometry window, and scaling options assist with further SAR results analysis. For example, when viewing maximum SAR value statistics, users can adjust any power, any SAR value, or the power scaling factor to determine their effect.
Post-Processing
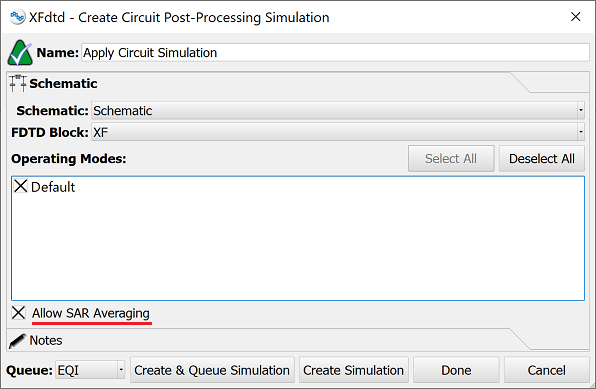
Users can apply S-parameter data collected during the FDTD simulation to a schematic for matching network design and VOP compression analysis. Within the schematic, the circuit's topology, component values, and operating modes are defined and circuit-based results are available for analysis. Once finalized, an apply circuit simulation is created to combine the schematic and FDTD simulation, then recompute full-wave results with the schematic applied. Users can perform SAR averaging during this step without rerunning the entire FDTD simulation.
References
- International Electrotechnical Commission (IEC) and the Institute of Electrical and Electronics Engineers (IEEE), IEC/IEEE 62704-1, Determining the Peak Spatial-Average Specific Absorption Rate (SAR) in the Human Body from Wireless Communication Devices, 30 MHz - 6 GHz - Part 1: General requirements for using the Finite-Difference Time-Domain (FDTD) method for SAR calculations, 2017.
- International Electrotechnical Commission (IEC) and the Institute of Electrical and Electronics Engineers (IEEE), IEEE. Std. 1528-2003, IEEE Recommended Practice for Determining the Peak Spatial-Average Specific Absorption Rate (SAR) in the Human Head from Wireless Communications Devices: Measurement Techniques, 2003.