
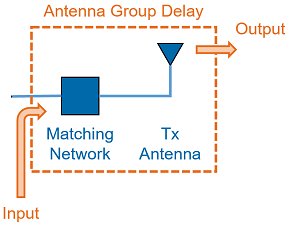
The Antenna Group Delay script allows users to compute group delay for a single-antenna simulation. Antenna group delay is impacted by the antenna's input impedance and the observation angles determined by a far-zone sensor. For a single far zone observation point, antenna group delay versus frequency, $\tau(f)$, is computed. Given $\tau(f)$ at a single point, the group delay variation, $\delta$, is $\tau(f)_{max} - \tau(f)_{min}$. For N observation points, there are N variation floating point numbers. A cumulative distribution function, CDF, is determined using the N variations.
The script's output options include generating graphs of $\tau(f)$ for each observation point in the far zone sensor, $\delta$ for each observation point when the far zone sensor is a slice in theta or phi, and the CDF of $\delta$.
Prerequisites
In order for the script to function properly, users must complete the following steps as part of the project setup workflow for antenna analysis:
- Add a steady-state far zone sensor with observation points where group delay is computed.
- Request multiple steady-state frequencies when creating the FDTD simulation. For increased efficiency, users can refer to XF's syntax for specifying frequency sets. For example, [2 GHz : 4 GHz : 0.5 GHz].
Workflow
Use the antenna group delay macro by following these steps:
- Download Antenna Group Delay.xmacro
- Either place the file in your Macros Menu directory, or right-click on Scripts in the Project Tree and choose Import Scripts.
A result must be selected in order for the script to operate.
- Select a far zone sensor result, such as gain, in the bottom portion of the Results browser.
- Execute the script by selecting it in the Macros Menu, or right-clicking on the imported script in the Project Tree and choosing Execute.
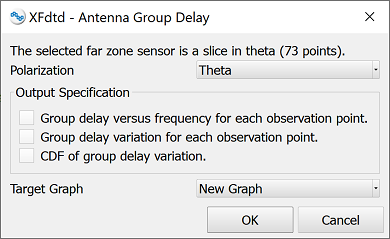
Executing the script opens a user-input window. The available outputs depend on whether the selected far zone sensor contains a single observation point, multiple points contained in a single slice in theta or phi, or multiple points in both axes.
- Select the desired Polarization.
- Select the output results of interest.
- Select the desired Target Graph.
- Click OK.
The script reads the required data off disk, computes antenna group delay for the specified observation angles, and outputs $\tau(f)$, $\delta$, or a CDF of $\delta$ to a graph.