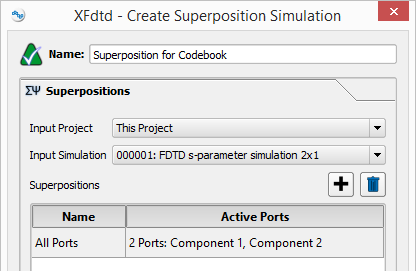
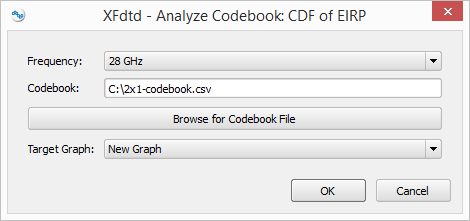
The Analyze Codebook: CDF of EIRP script plots the cumulative distribution function (CDF) of the max hold for an antenna array with numerous beam states. Each beam state specified in a text file is defined by a set of port magnitude and phase values. This capability supports bulk processing of a codebook by allowing users to analyze tens or hundreds of individual array states.
In addition to the functionality documented below, the Analyze Codebook: CDF of EIRP script also serves as a starting point for a customized workflow. XF's scripting API offers access to all result types, allowing script extensions that support bulk processing of power density and total radiated power, for example. Script adaptations also support various codebook file formats, including multiple steady-state frequencies and beam pairs. Users in need of assistance with customizing this script should contact Remcom Technical Support.
Prerequisites
In order for the script to function properly, users must set up a project and create an FDTD simulation:
- Excite each antenna array element with a circuit component—either lumped or distributed—or modal waveguide.
- Define a far zone sensor. The sampling intervals of the theta and phi angles may be fairly large, such as 5 or 10 degrees.
- Request S-parameters and select all ports feeding the arrays when creating the FDTD simulation.
- Specify one or more steady-state frequencies when creating the FDTD simulation.
Workflow
After meeting the prerequisites, users can run the macro by following these steps:
- Download the Analyze Codebook CDF of EIRP.xmacro
- Right-click on Scripts in the Project Tree and select Import Scripts.
Once the script is available, select a result.
- Open the Results browser.
- In the lower portion of the Results browser, select a steady-state far zone result from the superposition simulation.
- In the Scripts branch of the Project Tree, right-click on Analyze Codebook CDF of EIRP and choose Execute.
The script loads the far zone sensor, reads the CSV codebook file, sets the port values for each beam state, determines the max hold for all the beam states, and adds a plot of the CDF of the max hold to the specified graph.


