XF's superposition simulations and array optimization allow users to perform various types of antenna array analysis.
These options support the following use cases:
- Phased array: multiple antenna elements operating together in order to generate a steerable beam.
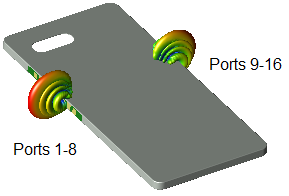
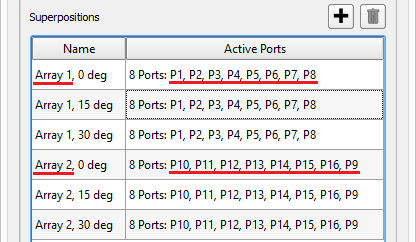
- Spatial diversity: two phased arrays operating in concert in order to increase coverage over a wider range of angles.
- Dual-polarized array: multiple antenna elements, each element fed with two feeds—one for horizontal and one for vertical polarization.
- Subarray: several radiating elements grouped to form a subdivision of an array with a large number of radiating elements.
- Codebook: predefined available power and phase weights provided in a file.
Prerequisites
In order to use the superposition simulation and array optimization features, users must set up a project for analyzing an antenna in XF:
- Excite each antenna array element with a circuit component—either lumped or distributed—or modal waveguide.
- Define a far zone sensor when using array optimization. This step is optional when creating a superposition simulation.
- Request S-parameters and select all ports feeding the arrays when creating the FDTD simulation.
- Specify one or more steady-state frequencies when creating the FDTD simulation.
- Wait for the simulation to complete.
Analysis of multiple arrays or subarrays requires enabled S-parameters for all the active ports in a single FDTD simulation. For example, users should simulate with two 8-element arrays with 16 ports enabled.
Creating a superposition simulation is not a prerequisite for array optimization, but array optimization utilizes the electromagnetic principle of superposition.
Creating Simulations
The superposition simulation and array optimization features utilize the electromagnetic principle of superposition in order to combine steady-state results from an FDTD S-parameter simulation. They differ in how they determine the available power and phase weights to each port.
A superposition simulation requires users to input the available power and phase for each port. The user interface settings do not explicitly define an array, however arrays are analyzed based on port selection and weighting. This feature is not specific to antenna arrays with far zone results, and can analyze results for any simulation provided the prerequisites are met.
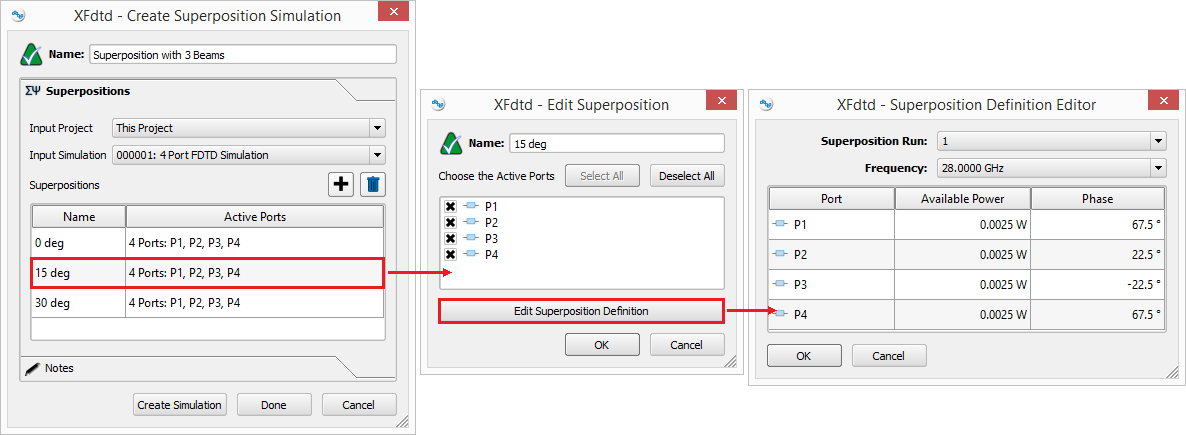
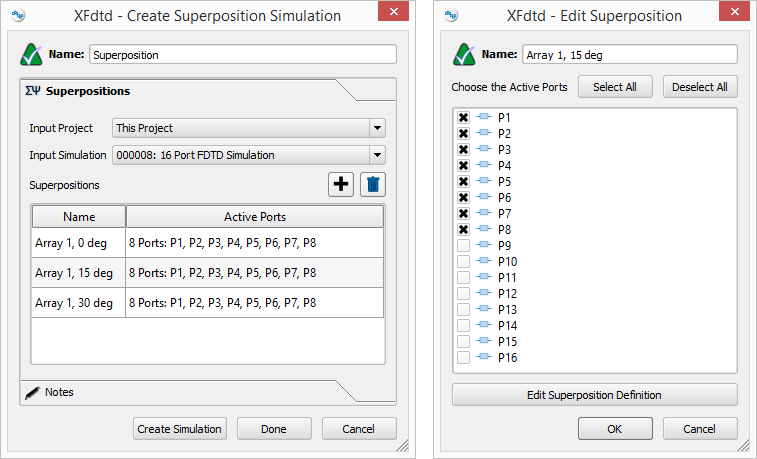
In the Create Superposition Simulation window's Superpositions tab, users create one superposition for each set of active ports and associated values. Multiple entries appear in the tab's table when multple arrays vary the port selection, or when one array steered in multiple directions produces varying port available power and phase values. Each entry appears as a set of results in the results browser.
Array optimization requires users to input the direction the antenna beam points and provide the set of allowable port phases. An optimization algorithm uses this information to determine the port phases that maximize the far zone EIRP in each direction. This feature applies only to FDTD simulations containing far zone results.
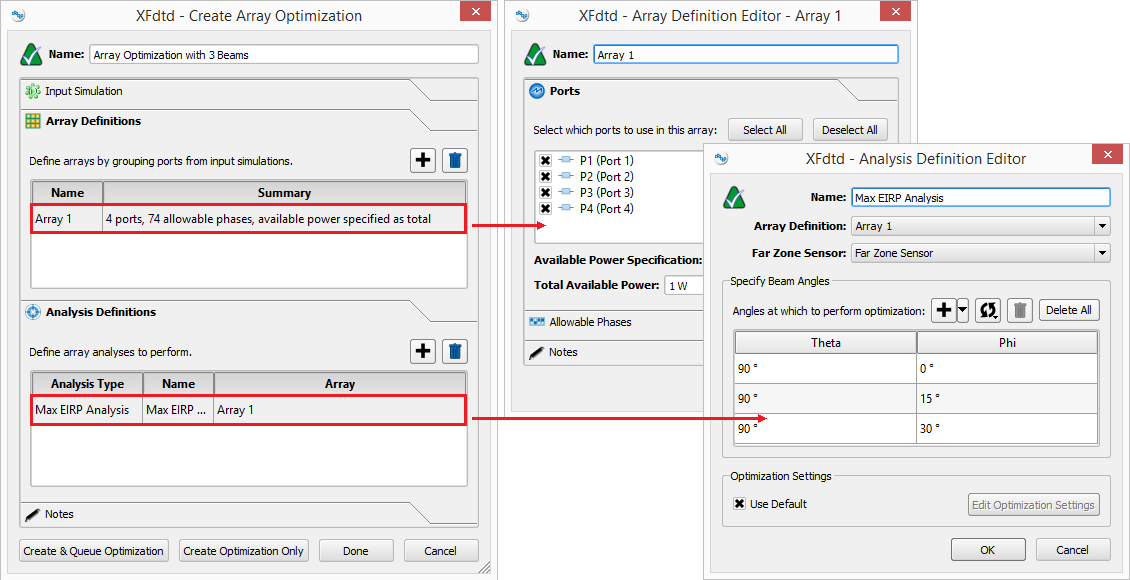
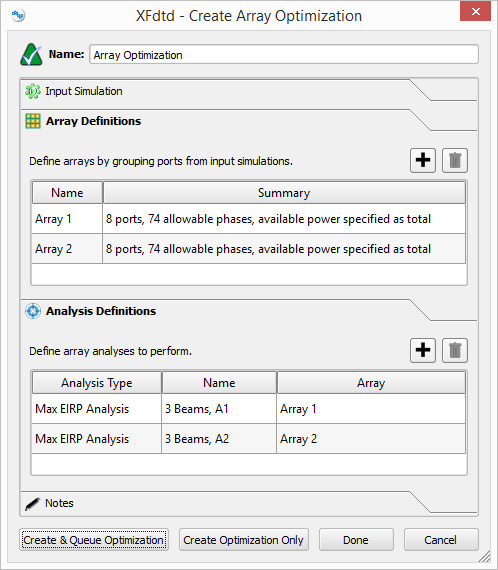
In the Create Array Optimization window's Array Definitions tab, users define arrays by selecting a set of ports and providing their allowable phase values. A port can be used in multiple arrays. In the Analysis Definitions tab, users specify the directions in which each array's main beam points. Each angle appears as a set of results in the result browser.
Analyzing Results
An FDTD simulation collects S-parameters by sequencing through all selected ports, considering one port active at a time and setting each inactive port to its passive load equivalent. The results associated with each active port within a simulation are then available for combination using a superposition simulation or an array optimization.
The superposition simulation and array optimization features are both based on the electromagnetic principle of superposition, but when creating simulations, they differ in how they determine port available power and phase values. Once these values are known, both features provide the same functionality for analyzing results. The max hold result is the only exception.
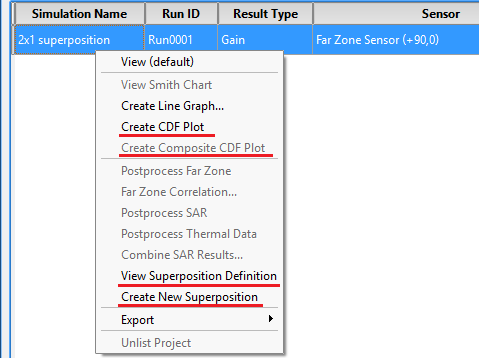
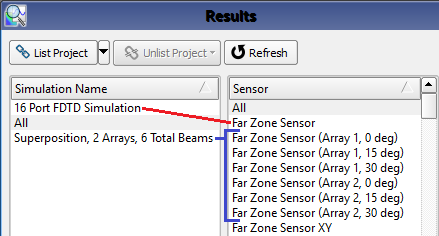
When creating a superposition simulation, users can add one or more entries to the table in the superpositions tab. Each entry appears in the results browser as an extension appended to its associated sensor's name in FDTD simulation.
Similarly, when creating an array optimization, users can add one or more analysis definitions to the table in the analysis definitions tab. Each specified angle appears in the results browser as an extension appended to its associated sensor's name in the FDTD simulation.
Codebook Considerations
A codebook provides the available power and phase values of each port for multiple beam states, and is analyzed using the superposition simulation feature. Array optimization is not applicable because the port available power and phase values are not set directly.
Two methods are available when using a superposition simulation. The first method involves manually entering the port available power and phase values for each beam state into the Create Superposition Simulation window's Superpositions tab. This is not recommended for a large number of ports and beam states.
The second method is preferred for bulk processing a large number of beam states. In this case, one default superposition is added to the Create Superposition Simulation window's Superpositions tab. An XF script accesses the superposition results, reads the codebook, sets the available power and phase values for each entry in the codebook, and exports a data summary for each beam state into a data file that is processed for anomalies and values exceeding the set threshold.
Superposition Example
Users can analyze of the first array's performance in three beam directions by following this workflow:
- In the Create Superposition Simulation window's Superpositions tab, add one superposition for each beam to analyze for a total of three table entries.
- The Edit Superposition window opens for each of the three superpositions. Each time, select ports 1-8 and deselect ports 9-16 in order to identify the first array.
- Open the Superposition Definition Editor window for each of the three superpositions and enter the available power and phase values per port.
Clicking the Create Simulation button adds the simulation to the Simulations window, and results are immediately available in the results browser for analysis.
Array Optimization Example
Consider the spatial diversity use case from the superposition example that analyzes three beam directions per array for a smart phone containing two 8-element phased array antennas. Array optimization determines which phases maximize the array's EIRP for each specified beam direction. It is the appropriate feature to use when the individual port phases are not known beforehand.

